
Welcome! This is the second entry in a five-part series in which I explore Visual Studio Mobile Center and how it can help simplify your development and testing of mobile apps. I’ll be covering the following topics in the series:
- Build Automation
- Crashes & Analytics
- Testing
- Distribution
- Push Notifications
Note that, since Mobile Center is technically still in preview mode, the information relayed here is subject to change. As always, check the documentation for the latest and greatest and keep an eye on the roadmap for official options on Mobile Center.
In this post, let’s see what tools we have available for crashes and analytics reporting. If you didn’t set up you’re own code base following along in Part 1, you can find my work here. Let’s start from the landing screen of your app, which has the details we’ll need for integrating the Mobile Center SDK, which we skipped in Part 1.
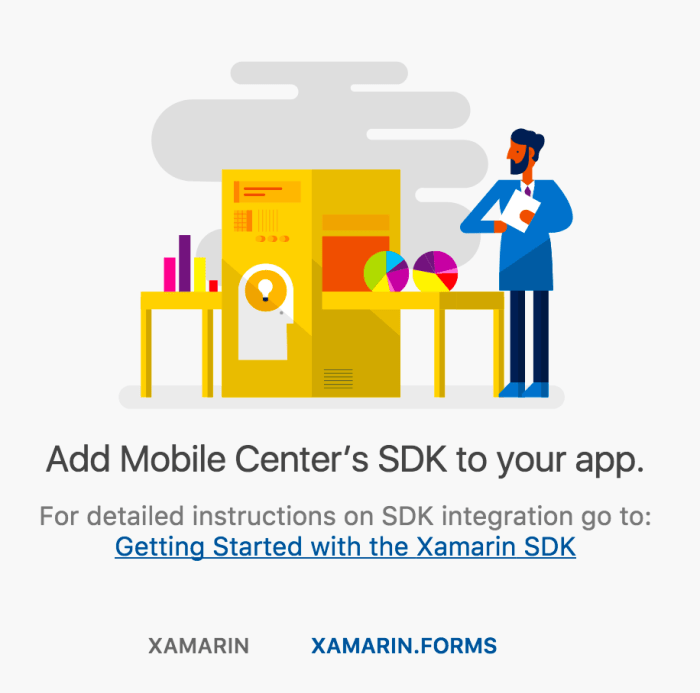
Follow the instructions for your platform, which includes an automatically generated GUID for your app/platform. If, as in my case, you are using Xamarin.Forms, copy the GUID value from each project into your App.xaml.cs file until you have a Mobile Center key for each platform you wish to support:
        protected override void OnStart()
        {
            // Handle when your app starts

            MobileCenter.Start("ios=1f55e7a2-0958-4dc0-ba63-cd0cb9e62988;" +
                   "uwp=7740dc08-60a3-47f0-9eb2-c602815280ad;" +
                   "android=970c6dac-5e92-4fd7-bbd8-2017d2cb3709",
                   typeof(Analytics),
                   typeof(Crashes),
                   typeof(Distribute),
                   typeof(Push));
        }
We’ll only be looking at Analytics and Crashes in this post, but go ahead and add the Distribute and Push libraries, as we’ll need them later. Now, let’s run our app; a simulator will be sufficient for testing the parts covered in this section, so no worries if you don’t have one of each device.
Crash Reporting
Aside: At the time of writing, Mobile Center does not support Crash Reporting in UWP apps
For the sake of demonstration, I added a failure point to my app. For the sake of argument, let’s say I intended to implement a click function “later”, forgot, and checked in my code anyway. Similar to a real world bug, the code successfully compiles, and the issues is unnoticed by QA before being distributed.
        void Handle_Clicked(object sender, System.EventArgs e)
        {
            // Joe, you've been a fool!
            throw new NotImplementedException();

            DisplayActionSheet("Action Sheet", "Cancel", null, new string[]{
                "Action 1",
                "Action 2"
            });
        }
Once the App is launched and run, we run into the issue in the wild. Crashes and analytics aren’t gathered right away, so it may be five or ten minutes before the error shows up in Mobile Center. After a patient wait, click Crashes to inspect our issue, which we’ll pretend in coming from a live Beta Tester and we, as developers, are only just now learning about:
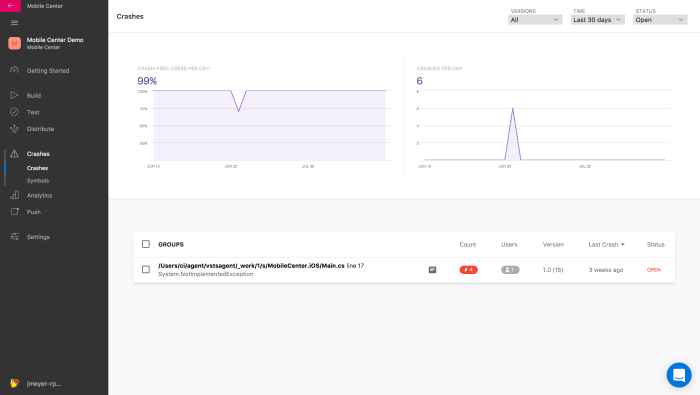
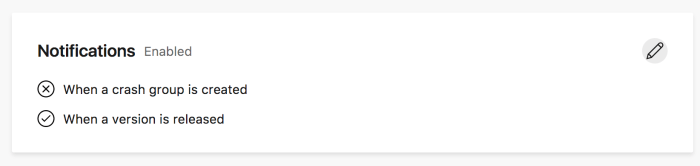
For each different type of crash that occurs, Mobile Center will group occurrences into appropriate buckets and gather information about the cause, frequency, and users/platforms affected. We have a fairly clean example here, but if the crash occurs outside of code we’ve written, you may see generic crash groups such as “Crash Group #30” in the queue. Care to be notified as soon as a new crash group is enabled? App Collaborators can enable email notifications in the settings section of your Mobile Center App.
By clicking into any crash group, we get a more detailed view of the issue, including a call stack and, if available, the line number where the crash occurred as well as more granular information of devices affected & frequency.
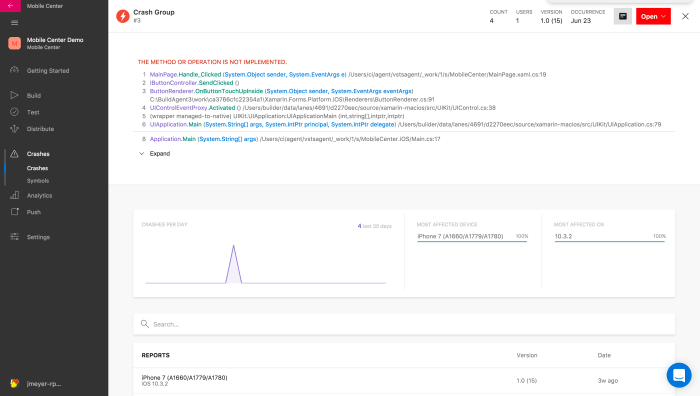
Once a crash is resolved, it can be closed using the status dropdown in the upper right so we don’t clutter up our view.
Analytics
Let’s imagine that our NotImplementedException is being thrown because we meant to capture some analytics on that click event. Returning to the method, we can track user clicks in the following way:
void Handle_Clicked(object sender, System.EventArgs e)
        {
            // You can also track an event with no dictionary
			Analytics.TrackEvent("Button Clicked");

            DisplayActionSheet("Action Sheet", "Cancel", null, new string[]{
                "Action 1",
                "Action 2"
            });
        }
For more detailed information, we can also pass a dictionary, which will aggregate any key/value combination of string values:
void Handle_Clicked(object sender, System.EventArgs e)
        {
            // You can also track an event with no dictionary
			Analytics.TrackEvent("Button Clicked", new Dictionary<string, string> {
				{ "Category", "User" },
                { "Time", DateTime.UtcNow.ToString()}
			});

            DisplayActionSheet("Action Sheet", "Cancel", null, new string[]{
                "Action 1",
                "Action 2"
            });
        }
As before, we’ll need to wait a few minutes before this data appears in Mobile Center, so let’s build and run our app, then click our button a few times before taking a quick break.
In the meantime, let’s explore the default data we get just by adding the Analytics SDK but navigating to the Analytics Section from our dashboard.

Each section is pretty self explanatory, but notice that we get a lot of neat charts and graphs for free:
- Active users – shows the count of user actively opening and using our app across a given day/wee/month period
- Daily sessions per user – shows how often per day a user opens our app
- Session duration – shows how long users have the app open and in the foreground
- Top devices – shows the make and model of devices that are installed the app and run it at least once
- Countries/Languages – shows in which countries our app is being used and what language the devices it is installed on are defaulted to.
- Active devices per version – shows which versions of the app are running across all active devices and implies adoption rate across the user base
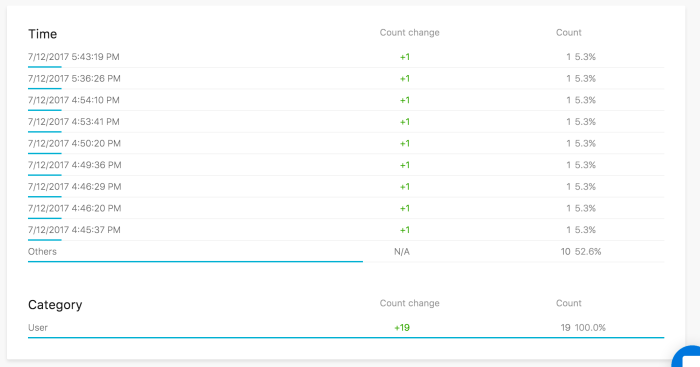
Having sufficiently explored our Analytics Overview, we can process to the Events section which captures the custom event we made earlier and any other special event we are tracking in the app. Much like the crash page, we can dive into specific captured events to glean more data on the event group.
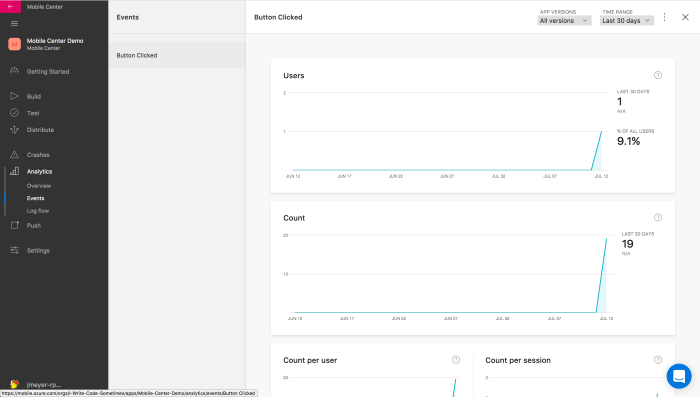
Your dictionary values are captured down below, and I’ve only just now realized how foolish it was to capture a timestamp: obviously, a smaller subset of potential “values” will aggregate into nice bar charts of varying length, rather than a meaningless jumble of even bars.
With that, we conclude Part 2 of this series! Check back soon for Part 3, where I’ll discuss Testing in Mobile Center

You must be logged in to post a comment.